CleverInsights Makes Ridership Reporting Easy

A dynamic ridership reporting solution built for today's agencies

Sorting through the enormous amount of raw data your passenger counters create and ensuring its accuracy can be daunting without the right tools.

CleverInsights makes ridership reporting more straightforward than ever. It gives you all the tools to clean, validate, visualize, and report on your ridership levels to make data-driven decisions, improve your service, and exceed your passengers’ expectations.

CleverInsights Device Array_updated screenshots-01
PRODUCT FACT SHEET

CleverInsights:
Ridership Reporting

CleverInsights makes ridership reporting more straightforward than ever. Whether you’re an executive needing to monitor high-level Key Performance Indicators (KPIs) or a power user generating detailed reports, CleverInsights gives you all the tools to clean, validate, visualize, and report on your ridership levels to make data-driven decisions, improve your service, and exceed your passenger’s expectations.

WEBCAST

See what's new in CleverInsights: Register for our webcast on February 2

Join our ridership reporting experts for a webcast and live demo of CleverInsights on Friday, February 2, including new features like "What If" scenario modeling and our manual checker application for tablets. Together, we'll explore all the ways CleverInsights can help your agency build a better solution for ridership reporting.

A Better Solution for Ridership Reporting

Ridership Visibility at Your Fingertips

CleverInsights is an easy-to-navigate, intuitive ridership reporting solution that allows you to quickly view your most important KPIs and easily recognize trend indicators with our customizable dashboards. All the information you need for accurate ridership reporting is available right at your fingertips:

Dashboard Screen Blue Icon-01-1

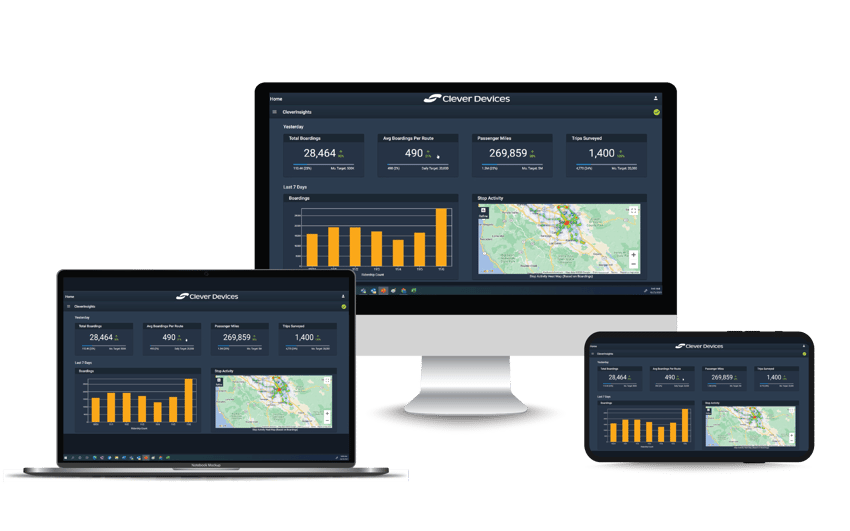
Customizable Dashboards

Tailor your personal landing page to monitor the KPIs most relevant to your role and responsibilities within your agency.

Data Processing Icon Blue-01-1

Transparent Data Processing

Easily see how data is being processed using rules outlined by your organization. Learn why and what exclusions were made.

NTD Icon Blue

Easy NTD Reporting

Easily review ridership data to ensure the accuracy of your NTD reporting and secure critical federal funding for your agency.

Easy Check Blue Icon-01

No ITS Expertise Required

Everyone at your agency can leverage CleverInsights' powerful features without extensive training or experience.

Cloud Data Icon Blue-01

Cloud-Based for Easy Access

Access ridership data from wherever you are from a variety of internet-enabled devices for greater visibility.

Percent change resized

Quickly see how your ridership compares to the same day the week before, right from your main dashboard.

Easily view your data how you want with drag and drop dynamic filters.

Drag and Drop Dynamic Filters resized
Click filters resize

Filter your reports on the fly, no need to reprocess your data.

View and manage your data processing rules for full transparency.

data processing rules resized
exclusion details resized

Excluded data is kept available to view in the excluded report to aid in identifying issues with incoming APC data.

Export your filtered reports to share with your team or save them for use again and again.

export or save report
whatif resized

The “what-if” feature in CleverInsights gives you the chance to see how a change to your data processing rules would reflect in your reports before making it permanent.

The integrated survey assignment feature allows you to send multiple surveys in a matter of seconds to your on-the-road checkers.

survey assignment resized
Checker Survey Tablet

Simplify your manual surveys with our tablet-based manual checker that offers visibility into survey status, functions offline, automatically records survey dates, and enables detailed passenger counts.

Schedule a Personalized Demo of CleverInsights
with a Clever Devices Product Expert